Tutorial 3: Large rasters#
This tutorial demonstrates floodsr with a larger raster and an end-to-end CLI run that fetches HRDEM and writes the super-resolved output in one shot.
What you’ll do:
verify the extended install from Extended Install
download and visualize a larger test raster
run
floodsr tohrwith--fetch-hrdeminspect both the fetched HRDEM and final output
Install floodsr#
This tutorial requires the extended install described in Extended Install.
floodsr uses this two-level installation approach to support as many users as possible:
the basic install for those who need something easy to install and dont need the extra machinery for handling large rasters, and
the extended install for those more comfortable with Python and who want to use the full power of
floodsrfor large rasters.
If you followed the instructions for the Basic Install, the simplest way to upgrade is to install a new environment per Extended Install.
And you should probably uninstall the old/previous basic environment to avoid confusion and free up disk space. See Installation for install and uninstall commands for each mode and execution context.
Proceed with Extended Install based on your execution context:
command line (CLI): copy and paste the commands from Command line (CLI) - Extended into your terminal.
local notebook (Jupyter): follow the same Command line (CLI) - Extended as for the CLI, then run the additional steps from Local notebook (Jupyter) - Extended so this notebook uses the correct kernel.
hosted notebook (Colab): Probably a bad idea. but see Hosted notebook (Colab) - Extended, or uncomment the experimental setup cell below if you’re feeling brave.
# Colab experimental setup
# !apt-get update -qq
# !apt-get install -y -qq gdal-bin libgdal-dev
# !pip install -q --upgrade pip
# !pip install -q "gdal[numpy]==$(gdal-config --version).*" rasterio geopandas pyproj shapely fiona
# !pip install -q floodsr
Prove the install#
Let’s check the versions now:
import matplotlib
import rasterio
import sys

print(f"matplotlib=={matplotlib.__version__}")
print(f"rasterio=={rasterio.__version__}")
print(f"python={sys.executable}")
matplotlib==3.10.8
rasterio==1.5.0
python=/opt/conda/envs/dev/bin/python
!floodsr --version
If these don’t work, double check you selected correct kernel (e.g., Python (floodsr-gdal)) for this notebook.
Imports#
import os
from pathlib import Path
from urllib.request import urlretrieve

import matplotlib.pyplot as plt
import numpy as np
import rasterio
from rasterio.enums import Resampling
Set Cache#
When rasters become large, caching downloads to disk can be a huge time saver.
This tutorial demonstrates a reusable cache directory so repeated HRDEM fetches and model resolution do not need to start from scratch each time. The size required by the cache (and your working directory for that matter) will of course depend on the size of the rasters you work with. For large rasters, this can be >10 GB.
Edit the below cell if you want floodsr to reuse a different cache directory.
# Edit this cell if you want `floodsr` to reuse a different cache directory.
base_cache_dir = "./_cache"

# windows example. un-comment and edit as needed.
# base_cache_dir = r"C:\Users\<you>\floodsr_cache"
# Resolve the cache path (and create if needed) once so later CLI cells can pass it directly.
base_cache_dir = Path(base_cache_dir).expanduser().resolve()
base_cache_dir.mkdir(parents=True, exist_ok=True)
print(f"cache_dir={base_cache_dir}")
cache_dir=/workspace/_cache
Set Paths#
let’s start by setting some paths to python variables for convenience
# Define the low-res input name and the derived output paths.
lowres_name = "inunriver_historical_000000000WATCH_1980_rp01000.tif"
hrdem_fp = Path(f"{Path(lowres_name).stem}_fetched_hrdem.vrt").resolve()
requested_result_fp = Path("result.tif").resolve()
result_fp = requested_result_fp

print(f"hrdem_fp={hrdem_fp}")
print(f"result_fp={result_fp}")
hrdem_fp=/home/cefect/LS/10_IO/2407_FHIMP/tmp/floodsr-tutorial_3-AurJ8Z/run/inunriver_historical_000000000WATCH_1980_rp01000_fetched_hrdem.vrt
result_fp=/home/cefect/LS/10_IO/2407_FHIMP/tmp/floodsr-tutorial_3-AurJ8Z/run/result.tif
Download Test Data#
For this tutorial, we use a tile from the old Aqueduct Floods Hazard Maps dataset.
A clip of this has been uploaded to our project repo for easy retrieval.
Fetch it into your working directory using the urlretrieve utility function again.
lowres_fp = Path(lowres_name).resolve()

urlretrieve(
    "https://github.com/cefect/floodsr/releases/download/v0.0.9/inunriver_historical_000000000WATCH_1980_rp01000.tif",
    lowres_fp,
)
assert lowres_fp.is_file(), f"could not find {lowres_fp}"
This fetches a raster like:
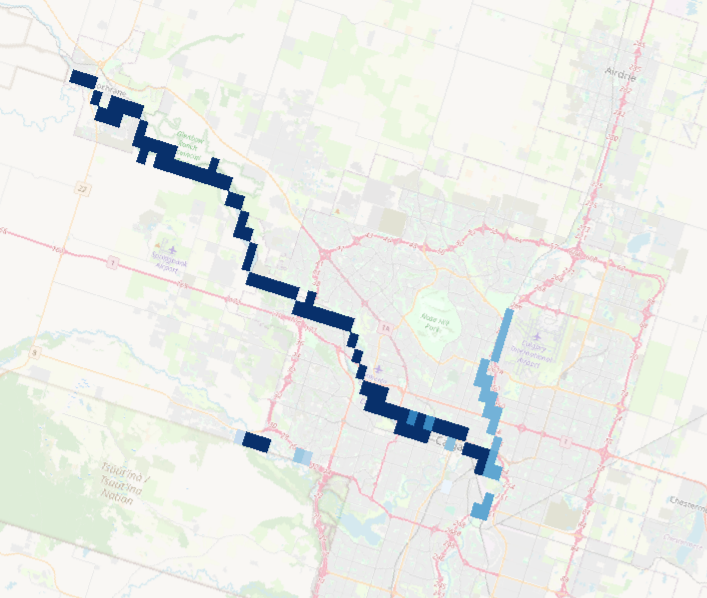
We can also plot it to get a sense of the input data.
with rasterio.open(lowres_fp) as src: # no helper function here because we need fancier loading below
    lowres = src.read(1).astype(float)
    if src.nodata is not None:
        lowres[lowres == src.nodata] = np.nan

    # print out some info about the input raster
    print(f"lowres raster: size={Path(lowres_fp).stat().st_size / 1024**2:.1f} MB, shape={src.shape}, res={src.res}, crs={src.crs}")


plt.figure(figsize=(6, 4))
im = plt.imshow(np.where(lowres > 0, lowres, np.nan), cmap="Blues")
plt.colorbar(im, fraction=0.046, pad=0.04)
_ = plt.title(f"Low-res input depth")
lowres raster: size=0.0 MB, shape=(30, 60), res=(0.008333333333333333, 0.008333333333333333), crs=EPSG:4326
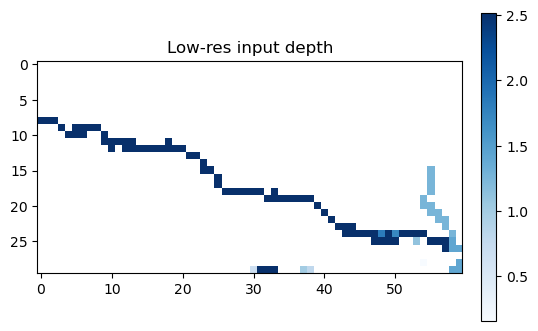
yuck
you’ll notice this raster uses EPSG:4326, which is lat/lon coordinates. Hence the goofy resolution.
We’ll want to keep this in mind when we set our --crs-policy.
Fetch HRDEM and Run tohr#
For this larger example, we use one CLI command to fetch HRDEM, resolve the model, and run super-resolution in one shot with the following arguments:
--in {lowres_fp}pointsfloodsrat the low-resolution flood-depth raster we downloaded above.-f/--fetch-hrdemtellsfloodsrto fetch HRDEM directly instead of requiring a local DEM file ahead of time.--fetch-out {hrdem_fp.name}keeps a copy of the fetched HRDEM on disk so we can inspect it in the next section.--fetch-force-tilingforces the HRDEM fetch step to run in tiled windows. This is helpful for larger extents because it avoids trying to assemble the whole DEM in one large read.--cache-dir {base_cache_dir}tells both the fetch step and model-resolution step to reuse the cache directory we configured above.--window-method hardtells the ToHR runtime to use non-overlapping hard windows instead of feathered blending. For this large raster example, we set this explicitly because the large-raster memory-safe path is tied tohardwindowing (for now).--crs-policy use-demtellsfloodsrto treat the fetched DEM grid as the target grid when the input flood raster and DEM use different coordinate reference systems. In this example, the low-resolution flood raster is geographic (EPSG:4326) while the fetched HRDEM is projected (EPSG:3979).--out result.tifrequests a predictable output basename in the working directory. Depending on the active backend, the final artifact may be materialized as either a GeoTIFF or a VRT, andfloodsrprints the resolved output path on the last output line.--min-depth-threshold=0.1masks out very small predicted depths in the final output.
See CLI Reference for the full CLI reference.
# Run the one-shot fetch + super-resolution command through the notebook CLI.
!floodsr tohr --in {lowres_fp} -f --fetch-out {hrdem_fp.name} --fetch-force-tiling --cache-dir {base_cache_dir} --window-method hard --crs-policy use-dem --out {requested_result_fp.name} --min-depth-threshold=0.1
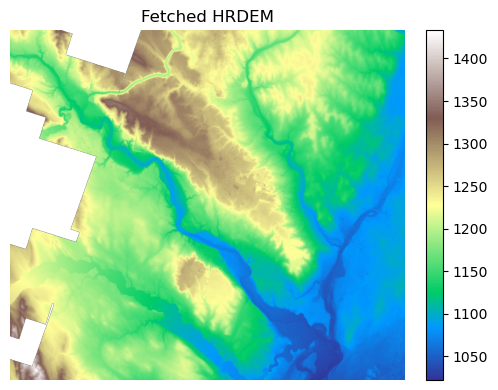
Plot the results#
The previous command wrote the fetched HRDEM to --fetch-out, so we can inspect the DEM tile directly.
To speed up plotting, we use a resampled version of the result. The raster is so large that the plot looks the same when resampled like this; however, be careful not to mix up your plotting work from your analysis work.
with rasterio.open(hrdem_fp) as src:
    preview_scale = max(src.height / 1024, src.width / 1024, 1)
    preview_shape = (
        max(1, int(src.height / preview_scale)),
        max(1, int(src.width / preview_scale)),
    )
    dem = src.read(1, out_shape=preview_shape, resampling=Resampling.nearest).astype(float)
    if src.nodata is not None:
        dem[dem == src.nodata] = np.nan

plt.figure(figsize=(6, 4))
im = plt.imshow(dem, cmap="terrain")
plt.colorbar(im, fraction=0.046, pad=0.04)
plt.title("Fetched HRDEM")
plt.axis("off")
plt.tight_layout()

print(f"DEM full shape: {src.shape}")
print(f"DEM preview shape: {dem.shape}")
DEM full shape: (36698, 41378)
DEM preview shape: (908, 1024)
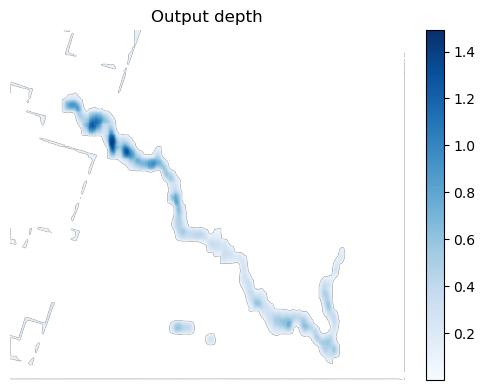
And now we plot the hi-res result
with rasterio.open(result_fp) as src:
    preview_scale = max(src.height / 1024, src.width / 1024, 1)
    preview_shape = (
        max(1, int(src.height / preview_scale)),
        max(1, int(src.width / preview_scale)),
    )
    result = src.read(1, out_shape=preview_shape, resampling=Resampling.bilinear).astype(float)
    if src.nodata is not None:
        result[result == src.nodata] = np.nan

plt.figure(figsize=(6, 4))
im = plt.imshow(np.where(result > 0, result, np.nan), cmap="Blues")
plt.colorbar(im, fraction=0.046, pad=0.04)
plt.title("Output depth")
plt.axis("off")
plt.tight_layout()

print(f"Output full shape: {src.shape}")
print(f"Output preview shape: {result.shape}")
Output full shape: (36698, 41378)
Output preview shape: (908, 1024)