Tutorial 3: Large rasters#
This tutorial demonstrates floodsr with a larger low-res flood raster and an end-to-end CLI run that fetches HRDEM and writes the super-resolved output in one shot.
What you’ll do:
verify the extended install from Extended Install
download and visualize a larger test raster
run
floodsr tohrwith--fetch-hrdeminspect both the fetched HRDEM and final output
Install floodsr#
This tutorial requires the extended install described in Extended Install. If you followed the instructions for the Basic Install, the simplest way to upgrade is to install a new environment per Extended Install. And you should probably uninstall the old/previous basic environment to avoid confusion and free up disk space.
Proceed with Extended Install based on your execution context:
command line (CLI): copy and paste the commands from Command line (CLI) - Extended into your terminal.
local notebook (Jupyter): follow the same extended install as for the CLI, then run the additional steps from Local notebook (Jupyter) - Extended so this notebook uses the correct kernel.
hosted notebook (Colab): Probably a bad idea. but see Hosted notebook (Colab) - Extended, or uncomment the experimental setup cell below if you’re feeling brave.
# Colab experimental setup
# !apt-get update -qq
# !apt-get install -y -qq gdal-bin libgdal-dev
# !pip install -q --upgrade pip
# !pip install -q "gdal[numpy]==$(gdal-config --version).*" rasterio geopandas pyproj shapely fiona
# !pip install -q floodsr
Install additional packages#
For this tutorial, we need the additional Python packages matplotlib and rasterio as shown in Tutorial 2
After you’ve done this, check versions:
import matplotlib
import rasterio

print(f"matplotlib=={matplotlib.__version__}")
print(f"rasterio=={rasterio.__version__}")
Imports#
import os
from pathlib import Path
from urllib.request import urlretrieve

import matplotlib.pyplot as plt
import numpy as np
import rasterio
from rasterio.enums import Resampling
Set Cache#
When rasters become large, caching downloads to disk can be a huge time saver.
By default, this notebook follows the same cache behavior as the source code: if no cache override is supplied, floodsr uses its normal platform cache location.
If you want to override that behavior, edit the below cell and set base_cache_dir to a path you want floodsr to reuse.
# Edit this cell if you want to override the default cache behavior.
base_cache_dir = os.getenv("FLOODSR_SHARED_CACHE_DIR")
if base_cache_dir is not None:
    base_cache_dir = Path(base_cache_dir).expanduser().resolve()
    base_cache_dir.mkdir(parents=True, exist_ok=True)


if base_cache_dir is None:
    print("cache_dir=None -> floodsr will use its default platform cache")
else:
    print(f"cache_dir={base_cache_dir}")
Set Output Paths#
# Define the low-res input name and the derived output paths.
lowres_name = "inunriver_historical_000000000WATCH_1980_rp01000.tif"
hrdem_fp = Path(f"{Path(lowres_name).stem}_fetched_hrdem.vrt").resolve()
result_fp = Path("result.tif").resolve()

print(f"hrdem_fp={hrdem_fp}")
print(f"result_fp={result_fp}")
Download Test Data#
We use a clipped tile from the old Aqueduct Floods Hazard Maps dataset.
lowres_fp = Path(lowres_name).resolve()

urlretrieve(
    "https://github.com/cefect/floodsr/releases/download/v0.0.9/inunriver_historical_000000000WATCH_1980_rp01000.tif",
    lowres_fp,
)
assert lowres_fp.is_file(), f"could not find {lowres_fp}"
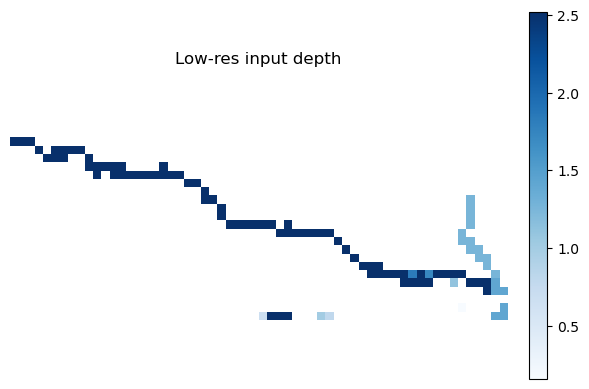
Plot the Low-Res Input#
with rasterio.open(lowres_fp) as src:
    lowres = src.read(1).astype(float)
    if src.nodata is not None:
        lowres[lowres == src.nodata] = np.nan

plt.figure(figsize=(6, 4))
im = plt.imshow(np.where(lowres > 0, lowres, np.nan), cmap="Blues")
plt.colorbar(im, fraction=0.046, pad=0.04)
plt.title("Low-res input depth")
plt.axis("off")
plt.tight_layout()

print(f"LR depth shape: {lowres.shape}")
yuck
Fetch HRDEM and Run tohr#
For this larger example, we use one CLI command to fetch HRDEM, resolve the model, and run super-resolution in one shot.
The fetched HRDEM is projected (EPSG:3979) while the low-res depth raster is geographic (EPSG:4326), so we pass --crs-policy=use-dem to reproject the depth raster onto the DEM grid.
The --fetch-out argument keeps a copy of the fetched HRDEM so we can inspect it in the next section.
If you left base_cache_dir as None, this command uses the default floodsr cache location.
# Run the one-shot fetch + super-resolution command through the notebook CLI.
cache_dir_arg = "" if base_cache_dir is None else f" --cache-dir {base_cache_dir}"
!floodsr tohr --in {lowres_fp} -f --fetch-out inunriver_historical_000000000WATCH_1980_rp01000_fetched_hrdem.vrt --fetch-force-tiling{cache_dir_arg} --crs-policy use-dem --model-version ResUNet_16x_DEM --out result.tif --min-depth-threshold=0.1
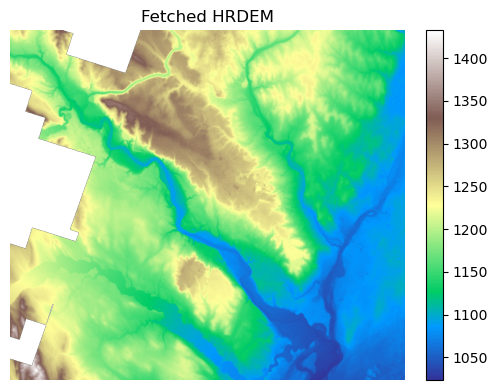
Visualize the Fetched HRDEM#
The previous command wrote the fetched HRDEM to --fetch-out, so we can inspect the DEM tile directly.
with rasterio.open(hrdem_fp) as src:
    preview_scale = max(src.height / 1024, src.width / 1024, 1)
    preview_shape = (
        max(1, int(src.height / preview_scale)),
        max(1, int(src.width / preview_scale)),
    )
    dem = src.read(1, out_shape=preview_shape, resampling=Resampling.bilinear).astype(float)
    if src.nodata is not None:
        dem[dem == src.nodata] = np.nan

plt.figure(figsize=(6, 4))
im = plt.imshow(dem, cmap="terrain")
plt.colorbar(im, fraction=0.046, pad=0.04)
plt.title("Fetched HRDEM")
plt.axis("off")
plt.tight_layout()

print(f"DEM full shape: {src.shape}")
print(f"DEM preview shape: {dem.shape}")
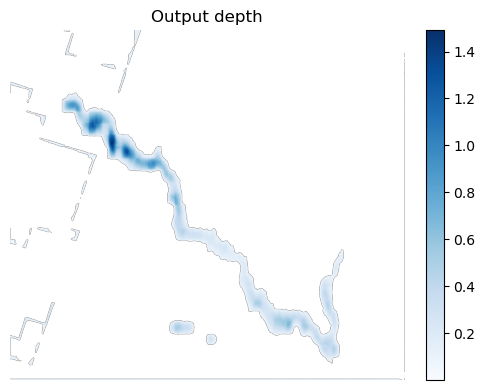
Visualize the Output#
with rasterio.open(result_fp) as src:
    preview_scale = max(src.height / 1024, src.width / 1024, 1)
    preview_shape = (
        max(1, int(src.height / preview_scale)),
        max(1, int(src.width / preview_scale)),
    )
    result = src.read(1, out_shape=preview_shape, resampling=Resampling.bilinear).astype(float)
    if src.nodata is not None:
        result[result == src.nodata] = np.nan

plt.figure(figsize=(6, 4))
im = plt.imshow(np.where(result > 0, result, np.nan), cmap="Blues")
plt.colorbar(im, fraction=0.046, pad=0.04)
plt.title("Output depth")
plt.axis("off")
plt.tight_layout()

print(f"Output full shape: {src.shape}")
print(f"Output preview shape: {result.shape}")